What It Actually Costs to Own a Supercar for One Year — The Numbers Nobody Shows You
The Purchase Price Is Just the Beginning. Here Is the Full, Uncomfortable Truth.
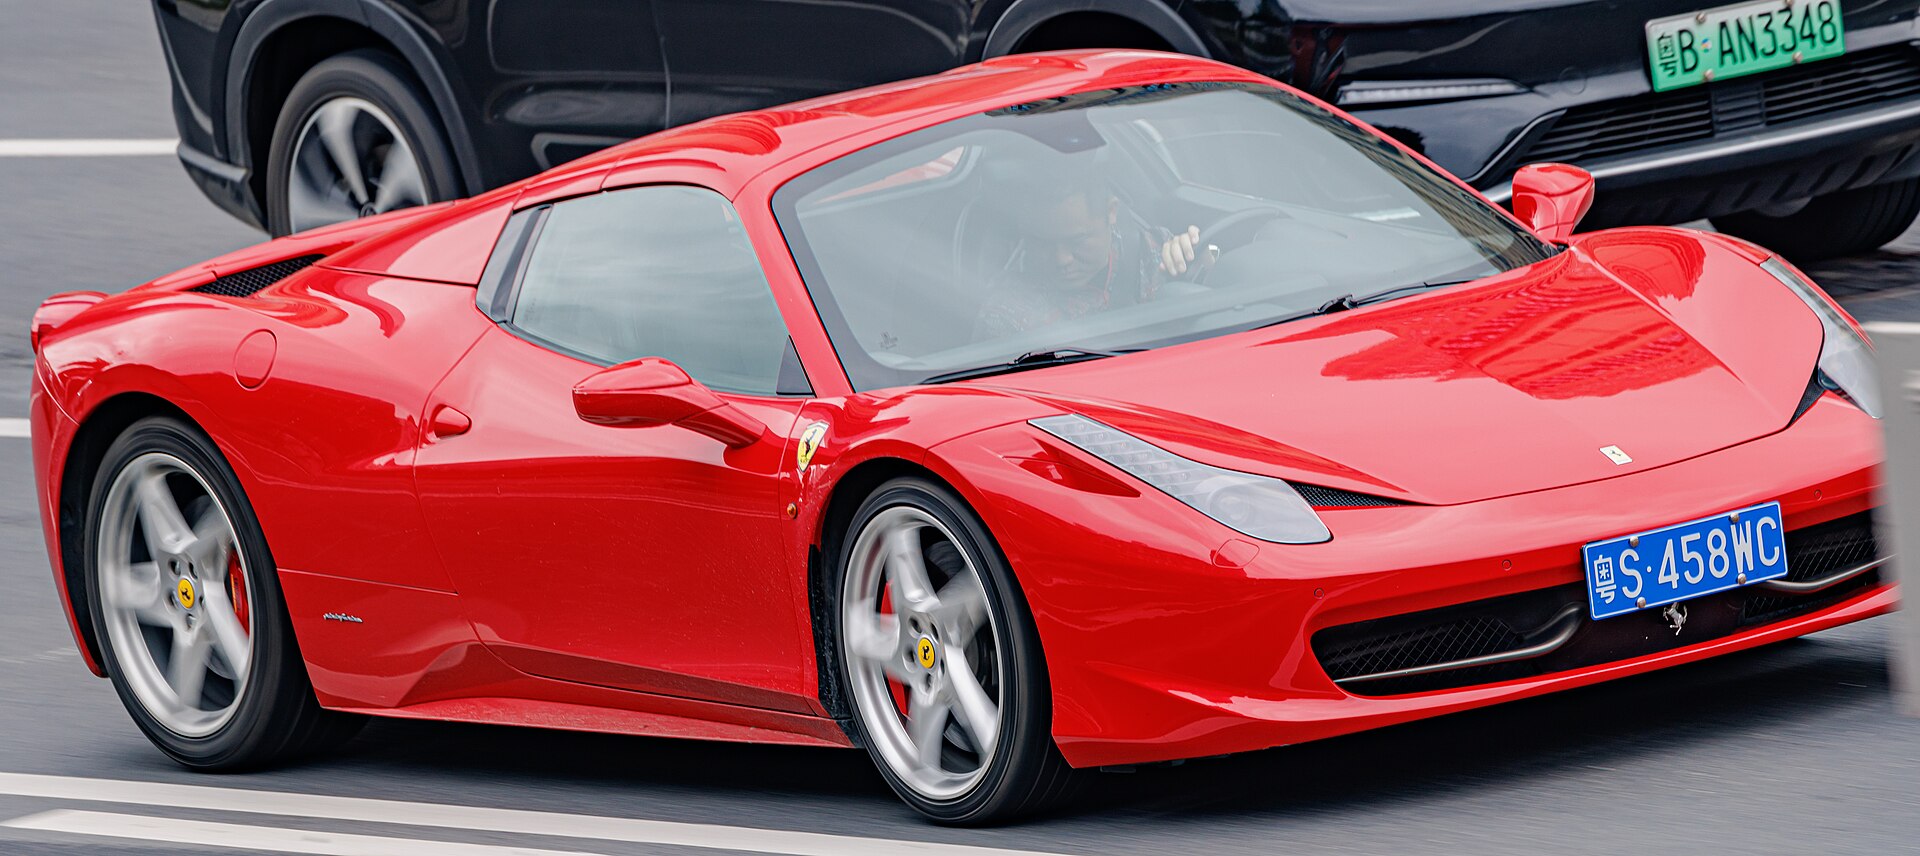
The Purchase Price Is Just the Beginning. Here Is the Full, Uncomfortable Truth.
Most articles about supercar running costs are wrong in the same way, and it is worth naming the error before we start, because everything below is built to avoid it.
They take a cost that occurs every four years — a set of carbon-ceramic discs, say, at $24,000 — and they put it in a table headed Annual Cost. Do that three or four times in one table and you produce a number that is nearly double the truth. The reader who actually owns the car spots it immediately, and stops believing the rest.
So this piece does something different. It amortises every lumpy cost over the interval at which it actually occurs, it shows that arithmetic openly, and it separates the money that leaves your bank account from the money you lose without ever spending it. Those are different things, and conflating them is the second-most-common error in this genre.
Read the assumptions before you read the numbers
A running-cost figure without a stated set of assumptions is meaningless. Insurance alone varies by a factor of five between a 52-year-old with a clean licence in a rural state and a 27-year-old in a city with one at-fault claim. Here is the exact case being modelled:
| Assumption | Value |
|---|---|
| Market | United States, dollars |
| Distance driven | 5,000 miles (8,000 km) per year |
| Warranty | Expired — the car is out of factory cover |
| Use | Road only, no track days |
| Storage | Garaged, not on the street |
| Driver | Over 35, clean licence, prior performance-car history |
| Cost of capital | 4–5% |
Change any one of these and the totals move, sometimes violently. Two of them move the answer more than everything else combined, and both get their own section below.
On the numbers themselves: these are indicative market ranges, assembled to make the model work, not quotations from named dealers on a given date. Parts prices, labour rates and insurance premiums move constantly and vary enormously by region and by car history. Treat the framework as the useful part and your own three quotes as the authoritative part. Any article that claims to give you exact costs for a car it has never seen, with a history it does not know, in a market it does not name, is selling you certainty it does not have.
The three kinds of money
Cash costs leave your account this year. Insurance, servicing, fuel, tyres, storage. This is the number you feel, and it is the one most people actually want.
Capital costs are what the money would have earned elsewhere. $250,000 sitting in a garage is $250,000 not sitting in an index fund or paying down a mortgage. At 4–5% that is $10,000–$12,500 a year, and it is a genuine cost of ownership even though no invoice ever arrives.
Depreciation is the value the car loses while you own it. Also real, also invisible, and unlike the other two it can be negative — a few of these cars have gained value, which is what makes the last tier strange.
Most articles blend all three into one headline figure. That inflates the number and hides which part you can actually control. Here they are kept apart.
Level 1 — Porsche 911 Carrera S · $120,000
The accessible end. Serviceable at a dealer network on three continents, usable in the rain, and — crucially — the only car here that a normal specialist can work on without factory tooling.
Amortising the lumpy items:
- Tyres $1,800–$2,800 per set, ~10,000 miles → every 2 years → $900–$1,400/yr
- Steel brakes, discs and pads $1,500–$3,000 → every ~4.5 years → $333–$667/yr
- Major service $2,500–$4,000 → every 4 years → $625–$1,000/yr
| Cash cost | Per year |
|---|---|
| Insurance (agreed value) | $2,000 – $5,000 |
| Servicing (minor annually + major amortised) | $1,425 – $2,500 |
| Tyres (amortised) | $900 – $1,400 |
| Brakes (amortised) | $333 – $667 |
| Fuel (250 gallons at 20 mpg) | $1,125 – $1,375 |
| Storage | $0 – $3,600 |
| Out-of-warranty contingency | $1,000 – $3,000 |
| Cash out per year | $6,783 – $17,542 |
| Invisible cost | Per year |
|---|---|
| Depreciation | $3,000 – $6,000 |
| Capital tied up ($120,000 at 4–5%) | $4,800 – $6,000 |
| True economic cost | $14,583 – $29,542 |
Note the gap between the two totals. The cash figure — call it $600–$1,500 a month — is what stops people buying. The economic figure is nearly double, and it is the honest one.
Level 2 — Ferrari 488 GTB · $250,000
This is where the servicing network narrows to approved workshops and the invoices stop resembling anything from normal motoring.
Amortising the lumpy items:
- Tyres $3,200–$5,000 per set, ~8,000 miles → every 1.6 years → $2,000–$3,125/yr
- Carbon-ceramic pads $2,000–$4,000 → every ~3.5 years → $571–$1,143/yr
- Major service $8,000–$15,000 → every 3 years → $2,667–$5,000/yr
| Cash cost | Per year |
|---|---|
| Insurance (agreed value) | $5,000 – $12,000 |
| Servicing (annual + major amortised) | $4,167 – $8,000 |
| Tyres (amortised) | $2,000 – $3,125 |
| Brakes (amortised) | $571 – $1,143 |
| Fuel (333 gallons at 15 mpg) | $1,500 – $1,833 |
| Storage | $0 – $6,000 |
| Out-of-warranty contingency | $3,000 – $10,000 |
| Cash out per year | $16,238 – $42,101 |
| Invisible cost | Per year |
|---|---|
| Depreciation | $5,000 – $12,000 |
| Capital tied up ($250,000 at 4–5%) | $10,000 – $12,500 |
| True economic cost | $31,238 – $66,601 |
One correction worth making loudly, because the internet gets it wrong constantly: carbon-ceramic discs are not an annual cost. On a road-driven 488 the discs frequently outlast the owner’s tenure. It is the pads that wear, and they are a fraction of the price. The terrifying $12,000–$20,000 disc figure is real, but it belongs to track use, and dividing it across a road car’s four- or five-year replacement cycle changes the picture entirely.
Level 3 — Lamborghini Aventador SVJ · $550,000
Here the consumables stop being consumables in any normal sense. The V12, the aero loading and the single-clutch ISR gearbox each generate a cost that has no equivalent below this level.
Amortising the lumpy items:
- Major service $12,000–$22,000, every 15,000 km → at our mileage, every 1.9 years → $6,436–$11,799/yr
- Clutch $15,000–$22,000, every 20,000–30,000 km → every ~2.5 years → $6,034–$8,850/yr
- Carbon-ceramic brakes $18,000–$30,000 → every ~6 years on road use → $3,000–$5,000/yr
- Tyres $5,000–$8,000 per set, ~5,000 miles → roughly annual → $5,000–$8,000/yr
| Cash cost | Per year |
|---|---|
| Insurance (agreed value, specialist) | $10,000 – $30,000 |
| Servicing (annual + major amortised) | $9,436 – $17,799 |
| Clutch (amortised) | $6,034 – $8,850 |
| Brakes (amortised) | $3,000 – $5,000 |
| Tyres | $5,000 – $8,000 |
| Fuel (455 gallons at 11 mpg) | $2,045 – $2,500 |
| Storage (climate-controlled) | $2,400 – $8,400 |
| Contingency | $3,000 – $15,000 |
| Cash out per year | $40,915 – $95,549 |
| Invisible cost | Per year |
|---|---|
| Depreciation (SVJ residuals have been firm) | $0 – $20,000 |
| Capital tied up ($550,000 at 4–5%) | $22,000 – $27,500 |
| True economic cost | $62,915 – $143,049 |
The clutch is the line that catches people. It is a wear item on a schedule, not a fault, and an owner who drives 15,000 km a year meets it twice as often as this model assumes.
Level 4 — Bugatti Chiron · $3,000,000
At this level the running-cost conversation stops resembling motoring and starts resembling aviation.
Amortising the lumpy items:
- Major service $50,000–$100,000, every 10,000 km → at our mileage, every 1.24 years → $40,225–$80,450/yr
- Tyres $42,000–$50,000 per set, and at this mileage roughly one set a year
| Cash cost | Per year |
|---|---|
| Insurance (specialist syndicate) | $50,000 – $150,000 |
| Servicing (annual + major amortised) | $60,225 – $115,450 |
| Tyres | $42,000 – $50,000 |
| Fuel (556 gallons at 9 mpg) | $2,500 – $3,056 |
| Storage | $6,000 – $15,000 |
| Enclosed transport | $5,000 – $15,000 |
| Contingency | $10,000 – $50,000 |
| Cash out per year | $175,725 – $398,506 |
| Invisible cost | Per year |
|---|---|
| Depreciation | minus $50,000 to plus $150,000 |
| Capital tied up ($3,000,000 at 4–5%) | $120,000 – $150,000 |
Bugatti sends technicians to the car rather than the reverse — the “Flying Doctor” programme — and the Michelin tyres are X-rayed individually before fitting, because at the speeds the car is certified for a flaw invisible to the eye is a fatal one.
The fuel line is worth a second look. At 5,000 miles a year a Chiron burns around $2,750 of petrol, less than many owners spend on storage. The eye-watering fuel figures quoted elsewhere assume mileage nobody does. The W16 is thirsty per mile; it is the miles that are missing.
And the depreciation line can genuinely be negative. Well-specified Chirons have held and in some cases exceeded their original prices. It is the only car here where the largest invisible cost might arrive as a gain.
The single number that changes everything: warranty
Nothing else in this article moves the total as far as this one fact, and almost nobody writes about it.
An out-of-warranty V8 Ferrari with a failed component can generate a five-figure invoice in an afternoon. The same car under factory or approved-used cover generates a phone call. The difference is not marginal — across a year it is routinely the difference between the bottom of the ranges above and the top.
Approved-used warranty programmes exist for exactly this reason, and they are renewable annually on cars far older than most buyers assume. The premium is real money. It is also the cheapest volatility reduction available to a supercar owner, and the calculation is not “will I use it” but “can I absorb the year in which I would have”.
If you take one thing from this article, take this: get the warranty position clear before you agree a price, not after.
What actually ruins people
It is not the servicing. Owners budget for servicing. Three other things do the damage:
The insurance quote they never got. Obtain a firm quote before you commit to the car, not after. A quote is free and takes ten minutes. Discovering afterwards that your circumstances attract a $25,000 premium on a car you have already bought is a bad way to learn.
The single failure. Not the scheduled work — the unscheduled kind. A failure outside warranty on a low-volume car with no aftermarket alternative is the invoice that ends ownership. This is what the contingency line exists for, and the people who get hurt are the ones who set it to zero.
Buying the car that falls. Depreciation dwarfs everything else on this page. Choose badly and one year of value loss exceeds five years of maintenance. That is a purchase decision, not a running cost — which means it is the one you have the most control over, and the one made fastest.
If you are not in the United States
Every figure above is a US one. The model transfers; the inputs do not.
Insurance is generally cheaper in the UK and much of the EU than in the US, though agreed-value cover on exotics carries its own market.
Labour rates at approved workshops vary widely between countries, and independent specialists — legal and common in Europe for out-of-warranty cars — can cut servicing substantially, at some cost to resale documentation.
Annual taxation is where the divergence is sharpest. Several European countries levy engine-displacement or power-based annual taxes that simply do not exist in most US states, and on a large-capacity V12 they are not a rounding error. There is no US line for this because there is no US equivalent.
Fuel costs roughly two to three times more per litre in most of Europe than in the US — but as the Chiron line shows, at these mileages fuel is rarely the item that decides anything.
How to use this on a specific car
The tables are a framework, not an answer. To get your number:
- Get three insurance quotes on the exact car, with your details. Ten minutes, free, and it is the largest single variable.
- Ask a marque specialist what the next major service costs and when it falls. “When” matters as much as “what”: a car 500 miles from a major service is a different purchase from one just after it.
- Establish the warranty position in writing.
- Find out what the last three of that car sold for, not what they are advertised at.
- Divide every lumpy cost by its real interval — the arithmetic in this article, applied to your quotes.
Do that and you will have a number for your car in your market, which is worth more than anyone else’s average.
Is it worth it?
The wrong question, and the honest answer is that nobody buys these cars because the spreadsheet works.
But there is a version of the question that is worth asking, and it is this: can I absorb the worst year without it mattering? Not the average year — the year with the clutch, the failure and the renewal in it. Owners who can, enjoy their cars. Owners who cannot, spend the ownership afraid of the post, sell in a hurry, and lose more on the exit than every invoice combined.
That is the real threshold, and it has nothing to do with the purchase price.
Related reads: Supercar Investment Guide · Ferrari 488 Pista · Aventador SVJ · Porsche 911 Turbo · Bugatti Chiron · Daily-Drivable Supercars